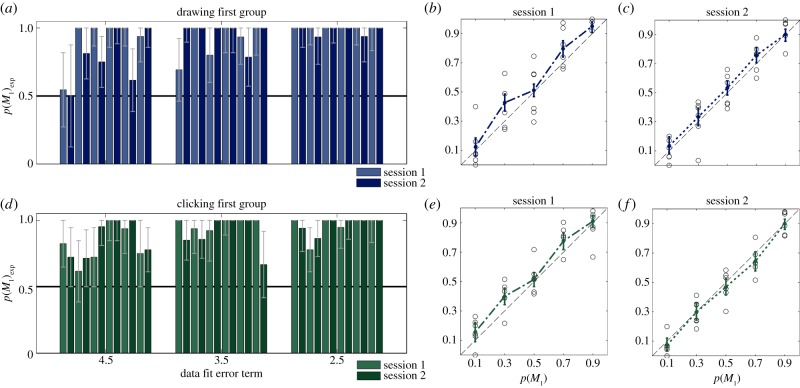
Figure 2.
(a,d) Occam's Razor observed in the experiment. The plots show the choice probability for the simple model M1 when presented with a stimulus that has equal goodness of fit for both models. Each bar corresponds to the choice behaviour of one participant in a particular error condition—error bars show the 95% CI. (a) Results for the group that performed the drawing session first and then the clicking session. (d) Results for the clicking first, then drawing group. Both groups show a clear bias towards the simpler model M1. (b,c,e,f) Pooled group choice probabilities. Circles represent individual participants median choice probability, the thick line (dash-dotted in the first session and dotted in the second session) shows the median using pooled data of all participants along with 95% CIs. The dashed black line illustrates the ideal case, where theoretical choice probabilities and observed choice behaviour match exactly. (b,c) Results for the group that performed the drawing session first. (e,f) Results for the group that performed the clicking session first. The individually fitted choice probabilities are shown in the electronic supplementary material, figure S6.

