
Figure 3.
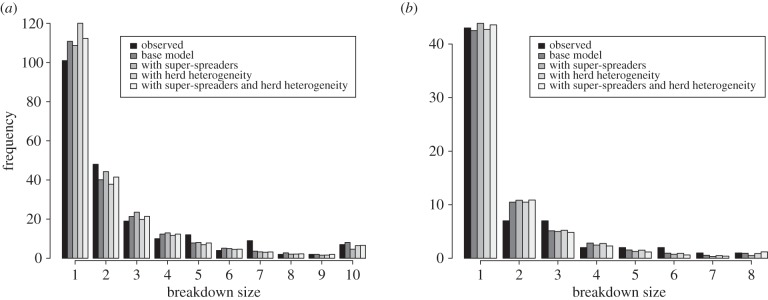
Comparison of the distribution of breakdown sizes for the models investigated for HRAs (top) and LRAs (bottom). The number of reactors found when a herd breaks down is determined over several simulations for each model and the distribution converted to a likelihood value that is used in the Markov chain Monte Carlo chain. We have grouped those breakdowns with 10+ reactors in HRA and 8+ reactors in LRA together.