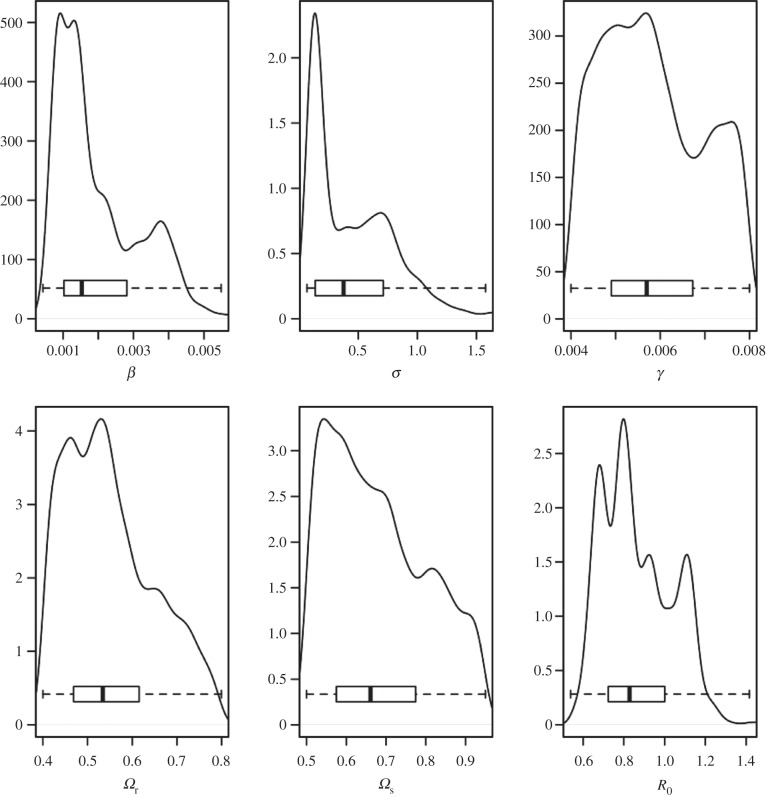
Figure 6.
Posterior kernel density estimates for the parameter distributions for the preferred model (including neither individual super-spreaders nor super-spread herds) for 4 year testing areas. Here β, σ, γ are the transition rates in our model, Ωr, Ωs are the sensitivities of the routine and abattoir tests.

