
Figure 3. Sensory-Driven Enhancement of Calcium Spikes.
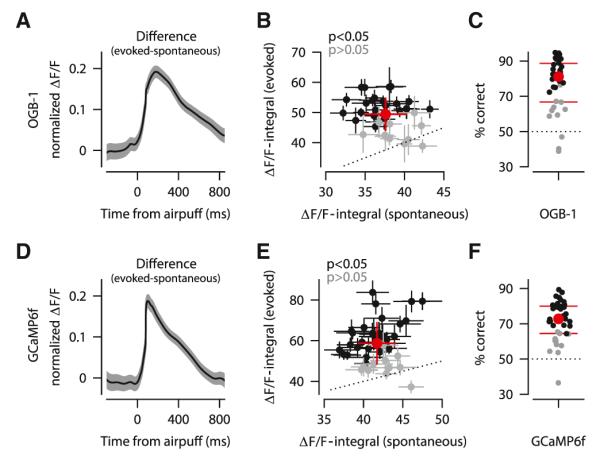
(A–C) OGB-1/AM experiments.
(D–F) GCaMP6f experiments.
(A and D) Difference between evoked and spontaneous CF-triggered fluorescence signals averaged across all dendrites (± SEM). All traces are normalized to the peak of the spontaneous trace of each dendrite separately.
(B and E) Average size of evoked and spontaneous calcium spikes in dendrites with a significant sensory-driven enhancement (black: mean ± SEM), and without (gray: mean ± SEM). Average ± SD of all dendrites is shown in red.
(C and F) ROC analysis showing % correct discrimination of sensory-evoked and spontaneous calcium spikes, for individual dendrites (black and gray as in B and E), and averaged across population (red: circle is median and lines are interquartile range). Dotted line indicates the chance discrimination level.