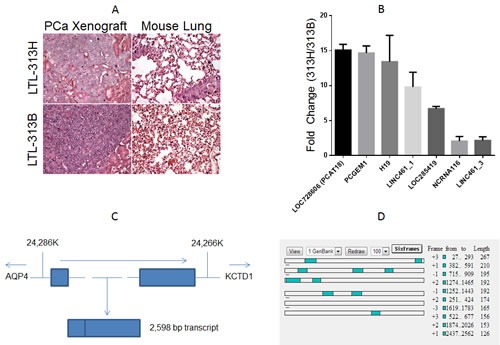
Figure1.

A Hematoxylin-eosin staining of the xenograft (left panels) and mouse lung tissue (right panels) of transplantable prostate cancer tumor lines LTL-313H and LTL-313B. LTL-313H cells are more locally invasive to the adjacent kidney than−313B cells, and show signs of distant metastatic spreading (never found in LTL-313B-engrafted mice). .B, qPCR confirmation of RNA Seq. data (columns represent average value, bars represent standard deviation, 2 replicate experiments). Values indicate relative expression level in LTL-313H vs. LTL-313B cells. We chose the 4 most up-regulated and 3 randomly selected transcripts. C, Schematic representation of the PCAT18 locus (NLM “Gene” website). The gene is located in a region between 24,286 and 24,266 K (Chromosome 18 primary assembly). Lines represent introns, rectangles represent exons. Dotted lines represent a relative distance that is bigger than the one shown in the picture. Arrows represent transcription direction. The genes flanking PCAT18 locus (AQP4, aquaporin-4; KCTD1, Potassium Channel Tetramerization Domain-Containing Protein 1) are shown. D, ORF finder output for PCAT18 sequence. Open Reading Frames are shown as shaded squares throughout the sequence. Each lane represents a possible reading frame. The software identified no ORF longer than 267 bp for a transcript longer than 2Kb. Considering 6 possible reading frames, protein-coding regions could account for no more than 16% of the whole transcript.
