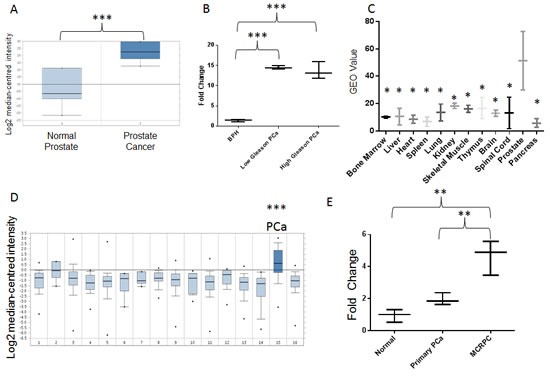
Figure2.

A, PCAT18 expression in normal prostate (n=6) and PCa (n=7) samples (horizontal bar represents median value, vertical bars represent minimum and maximum value per group). Query thresholds for all Oncomine analysis were p<0.01 and fold change>2. All Oncomine outputs passing these thresholds in prostate cancer studies are shown in Fig. 2. The non-significant correlations are summarized in Suppl. Table 6. Oncomine™ database (Compendia Bioscience, Ann Arbor, MI) was used for analysis and visualization. ***p<0.001 (Oncomine Analysis). Fold change: 7.2. B, PCAT18 expression (qPCR) in benign prostatic hyperplasia (BPH, n=5), low-Gleason (n=5) and high-Gleason (n=6) PCa samples. (Median-centered values, bars represent minimum and maximum value per group). ***p<0.001 (ANOVA and Tukey's post-test). C, Expression of PCAT18 in 12 benign tissues (GEO database, http://www.ncbi.nlm.nih.gov/geo/, study ID: HG-U95D), n=2 per tissue, horizontal bar represents mean value, vertical bars represent minimum and maximum value per group. *p<0.05 compared to prostate (ANOVA and Holm-Sidak`s post-test). Fold Change: 2.78-8.75 (prostate compared to other tissues). D, Oncomine analyis of PCAT18 expression in 16 tumor tissues (median-centered values, bars represent minimum and maximum value per group). Data are centered to the median level of expression in the whole cohort. Sample size for each tumor type is in brackets: 1. Bladder Cancer (32); 2. Brain and CNS Cancer (4); 3. Breast Cancer (328); 4. Cervical Cancer (35); 5. Colorectal Cancer (330); 6. Esophageal Cancer (7); 7. Gastric Cancer (7); 8. Head and Neck Cancer (41); 9. Kidney Cancer (254); 10. Liver Cancer (11); 11. Lung Cancer (107); 12. Lymphoma (19); 13. Ovarian Cancer (166); 14. Pancreatic Cancer (19); 15. Prostate Cancer (59); 16. Sarcoma (49). ***p<0.001 E, PCAT18 expression (qPCR) in plasma samples from normal individuals and patients with localized or metastatic castration-resistant (mCRPC) PCa, (median-centered values, bars represent minimum and maximum value per group) **p<0.01 (ANOVA and Tukey's post-test). Samples were processed as previously described [4] for plasma separation, RNA extraction, retrotranscription and quantification. Oncomine™ (Compendia Bioscience, Ann Arbor, MI) was used for analysis and visualization.
