
Figure 5. PLK1 inhibition induces cell death in Docetaxel-resistant cells.
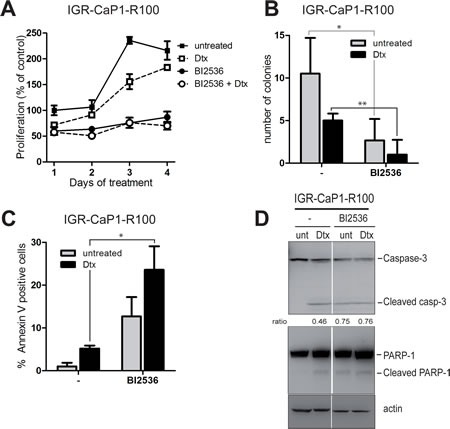
A: Cell proliferation assay. IGR-CaP1-R100 cells were treated for 4 days with the PLK1 inhibitor BI2536 at 200nM in the absence or presence of Docetaxel and with Docetaxel alone (100nM). Cell growth was assessed every day using WST1. Data are represented as mean ± SEM. B: Colony formation assay. IGR-CaP1-R100 cells were seeded in 6-well plates in triplicate and treated with 200nM BI2536 in the absence or presence of Docetaxel and with Docetaxel alone (100nM). Cells were stained with crystal Violet 3 weeks later. Data are represented as mean ± SD. P value was derived from the two-tailed Student's t test, significantly different (*P<0.05,). C: Apoptosis. Cells were treated for 48h with 200nM BI2536 in the absence or presence of Docetaxel and with Docetaxel alone (100nM). Apoptosis was assessed using annexinV and propidium iodide staining. P value was derived from the two-tailed Student's t test, significantly different (*P<0.05,). D: PARP and Caspase-3 cleavage. Cells were treated as in (C). Western-blot analysis was performed using specific antibodies for PARP1, Caspase-3 or β-actin. Ratio of cleaved Caspase-3 vs full-length is indicated.