Figure 2.
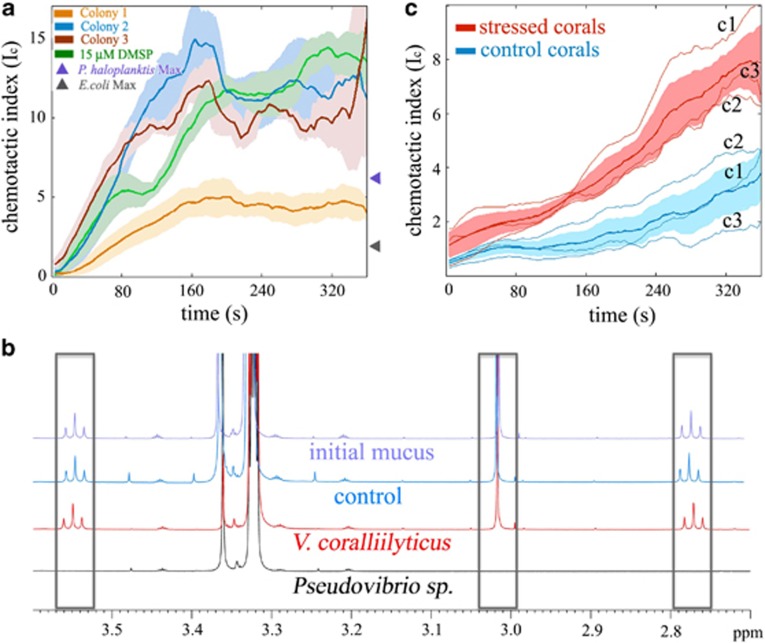
The pathogen's chemotaxis is primarily triggered by DMSP and is enhanced by heat stress of the host. (a) Time series of the chemotactic index, IC, (a measure of the strength of cell accumulation) of V. coralliilyticus in response to a 400-μm thick layer (Supplementary Figure S1) of coral mucus (Colonies 1–3) or 15 μM DMSP (green line). Solid lines and shading represent the mean and s.e. of three replicate experiments. Mucus was collected from three different colonies of P. damicornis on Heron Island and contained 11.9–14.8 μM DMSP (Supplementary Information). The pathogen responds with comparable intensity to DMSP and mucus. Shown for reference are also the maximum chemotactic indices (suitably converted from Stocker et al. (2008) attained over 15 min by E. coli responding to a mixture of two of its most potent chemoattractants at near-optimal concentrations (serine and aspartate, 10 μM each; gray triangle) and by P. haloplanktis responding to algal exudates (purple triangle). All data were normalized against the respective no-attractant controls. (b) Profiles from quantitative NMR of freshly collected P. damicornis mucus from Heron Island (initial mucus, purple) reveal distinct peaks for DMSP (gray boxes). Twenty-four hours of incubation of whole mucus with V. coralliilyticus (red) resulted in no measurable DMSP degradation, akin to the no-bacteria control (blue), whereas the positive control strain Pseudovibrio spp. degraded DMSP entirely, as evidenced by the disappearance of the DMSP peaks (black). (c) Time series of V. coralliilyticus' IC, in response to coral mucus from a clonally replicated temperature-stress experiment (maximum=31 °C) performed on Heron Island. Chemotaxis was twice as strong toward mucus from stressed coral fragments (red) as compared with fragments from the same colonies maintained at ambient temperature (blue). Thin lines show each of the three individual colonies (c1–c3), bold lines show their mean and shading represents the s.e. All curves were normalized against seawater controls.

