Figure 1.
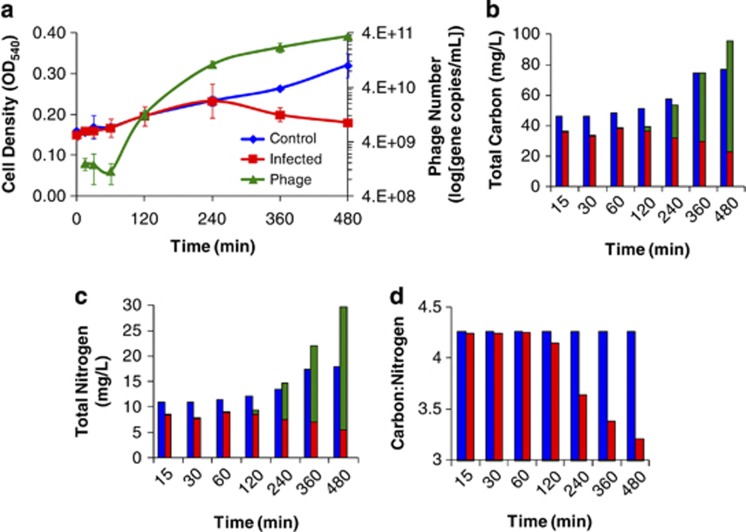
(a) Sulfitobacter sp. 2047 cell density (OD540) and phage concentration at each metabolite sampling time point reported in Figure 2. Line graphs are color coded as follows: phage-infected culture ( ), control culture (
 ) and phage numbers (
 ). Turbidity declines are indicative of phage-induced lysis. Phage numbers were derived from qPCR assays. Averages and ranges of biological duplicates are reported. Estimates of (b) carbon and (c) nitrogen content and their (d) ratios for Sulfitobacter sp. 2047 cells and phage during an infection cycle. Bar graphs are color coded as follows: phage (
 ), infected culture (
 ) and control culture (
 ). Bacterial cell densities were determined by microscopy. Phage numbers were determined using qPCR. Bacterial carbon (149 fg C per cell) and nitrogen (35 fg N per cell) were derived from literature values of marine bacteria as reported in text. Phage carbon (0.2 fg C per phage) and nitrogen (0.076 fg N per phage) were derived from theoretical calculations (Jover et al., 2014). Values reflect the average of duplicate biological replicates.

