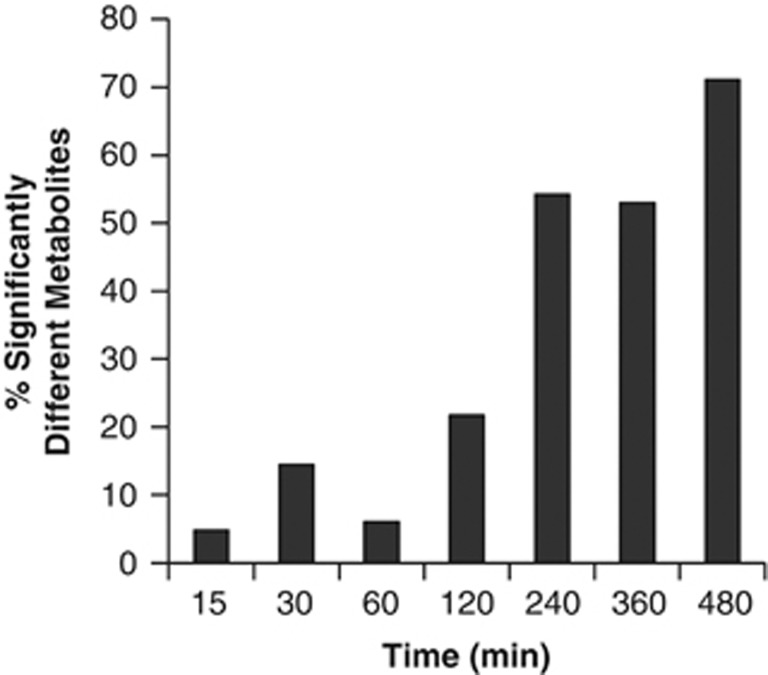
Figure 3.
Variation in intracellular metabolite concentrations between phage-infected and control populations during the infection cycle shown in Figure 2. Columns indicate fold changes ⩾1.5 and P⩽0.05, and all data are shown in Supplementary Tables S3 and S4.

