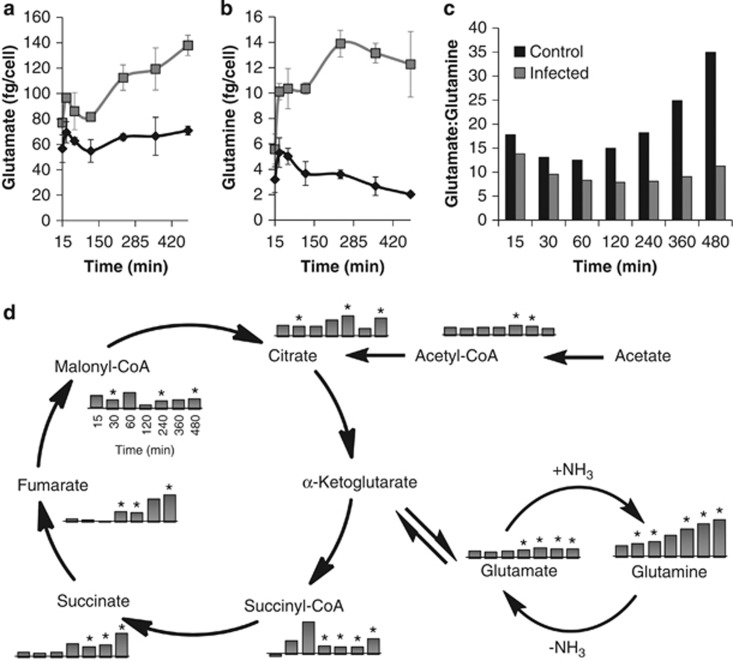
Figure 4.
Absolute concentrations of (a) glutamate and (b) glutamine in control (♦) and phage-infected (▪) Sulfitobacter sp. 2047 populations. Values represent duplicate biological and duplicate technical replicates. Error bars show the s.e.m. (c) Glutamate to glutamine ratios for phage-infected and control populations throughout the experimental time course. Bar graphs are coded as indicated by the key in each figure. (d) Selected metabolites are shown to illustrate the relationship between the tricarboxylic acid (TCA) cycle and glutamate and glutamine metabolism in Sulfitobacter sp. 2047. The bar graphs represent concentrations for metabolites in the phage-infected culture and are expressed as fold change relative to the control at the corresponding time point as shown for malonyl-Coenzyme A. Fold changes are log2 transformed and represent averages of duplicate biological and technical replicates. Asterisks designate significant fold changes (⩾1.5 and P⩽0.05).

