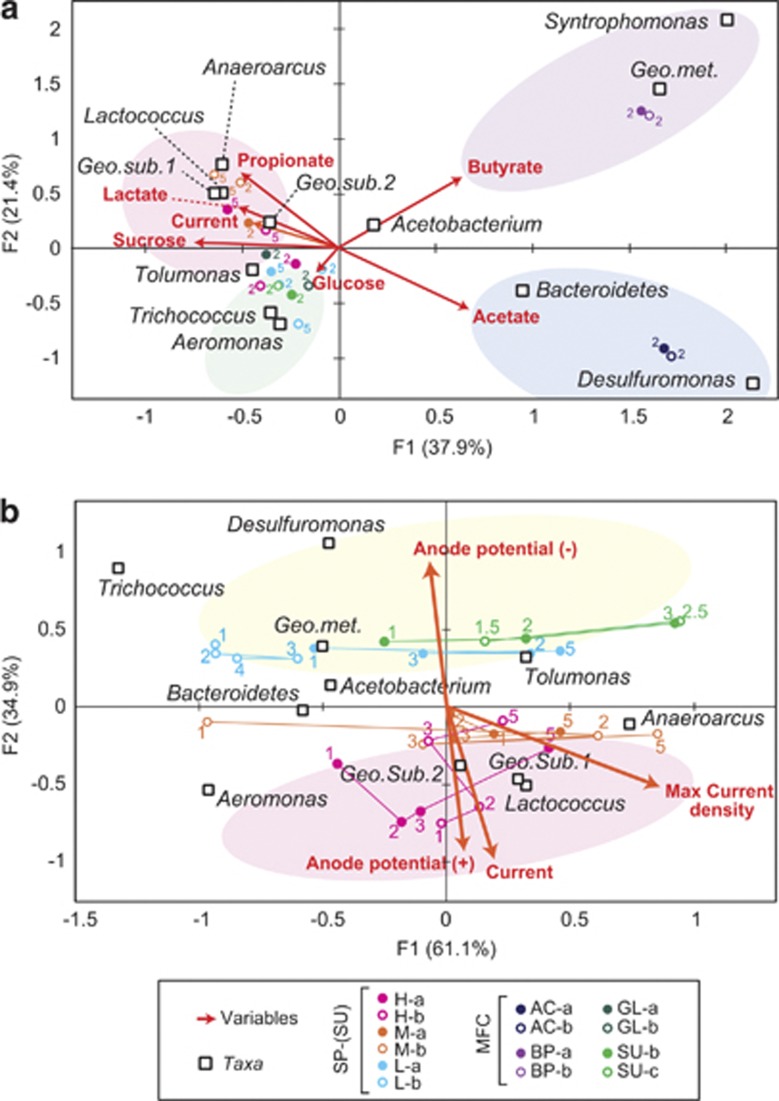
Figure 10.
CCA diagram correlating microbial taxa and the environmental factors. CCA diagrams reveal the relationships between operational variables and microbial taxa in MFC/SP reactors. Panel a shows relationships associated with metabolic variables indicated as red arrows, and panel b shows relationships associated with electrochemical variables indicated as orange arrows. Solid (for reactor ‘a') and open (for reactor ‘b') circles indicate samples for microbial community analyses of MFC/SP reactors (with different colors summarized in legend panel). Sampling months are indicated by the numbers close to the symbols. The 12 most highly abundant genus-level taxa are shown as open squares, and genus Geobacter is divided into the three described sub-clades (Geo. met., Geobacter metallireducens clade; Geo. Sub. 1, Geobacter subsurface clade 1; Geo. Sub. 2, Geobacter subsurface clade 2). Phylum Bacteroidetes is also shown as an open square; however, it represents all phylotypes associated with Bacteroidetes.

