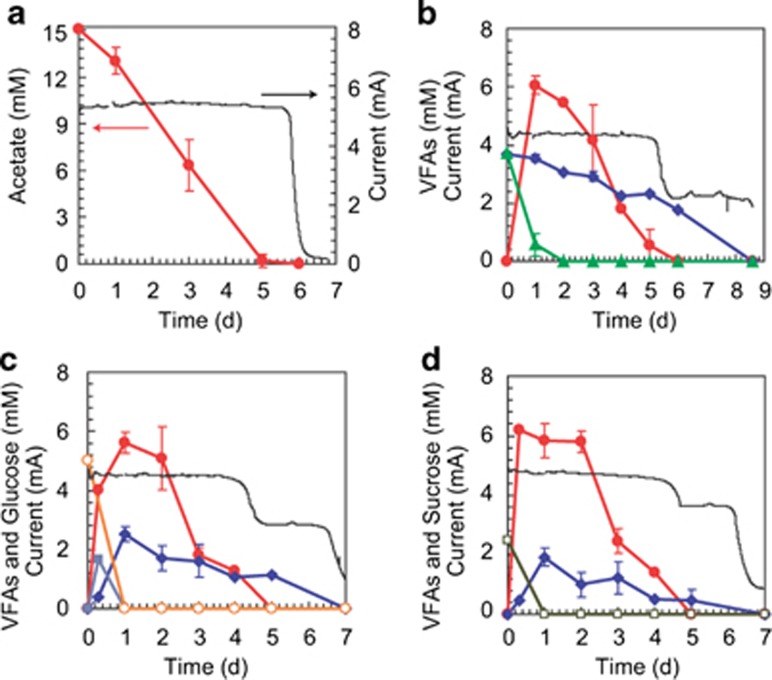
Figure 4.
Exemplary current generation and substrate consumption rates in MFCs fed with different carbon sources. Typical batch cycle of reactor ‘a' of AC-MFCs (a), BP-MFCs (b), GL-MFCs (c) and SU-MFCs (d) after the 3-month enrichment process. The black line indicates electric current (mA) with 22 Ω external resistance. Filled circles indicate acetate. Filled triangles indicate butyrate. Filled diamonds indicate propionate. Open circles indicate glucose. Filled squares indicate lactate. Open squares indicate sucrose.

