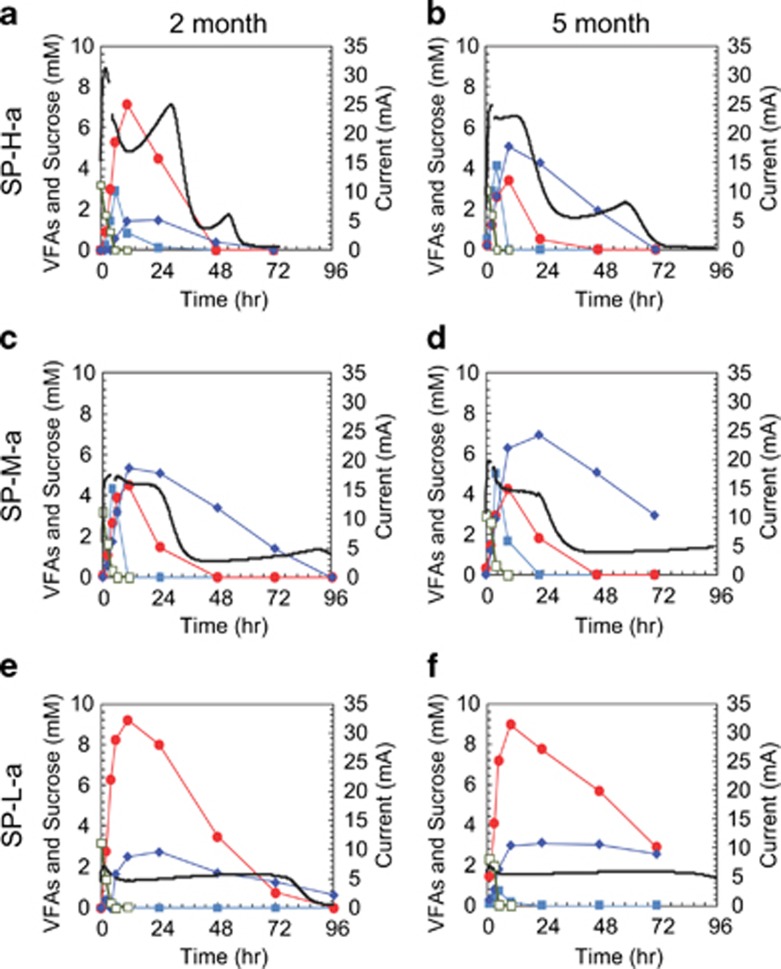
Figure 5.
Exemplary current generation and substrate consumption rates in SP reactors with different anode potentials. Typical batch cycle of reactor ‘a' under SP-H (a and b), SP-M (c and d) and SP-L (e and f) operation after the 2-month (a, c and e) and 5-month (b, d and f) enrichment process. The black line indicates electric current (mA) under anode potential controlled operations. Filled circles indicate acetate. Filled diamonds indicate propionate. Filled squares indicate lactate. Open squares indicate sucrose.

