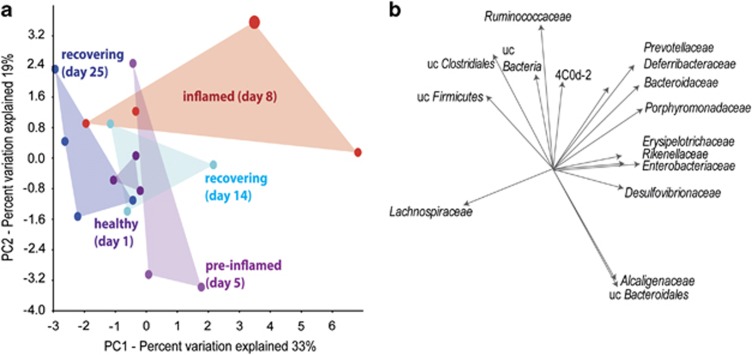
Figure 2.
Microbiota dynamics during acute colitis and recovery. (a) Score and (b) loading plot indicating the correlation between bacterial communities and the health state of the animals. PCA plots were calculated based on relative abundance of metatranscriptomic 16S rRNA reads of bacterial families. The score plot shows the relationship of individual samples. The loading plot defines the contribution of the original variables (bacterial families) to PC1 and PC2 but also indicates the relationship variables to each other, which were further determined by Pearson moment correlation analysis. uc, unclassified, 4C0d-2 Cyanobacteria-like lineage.

