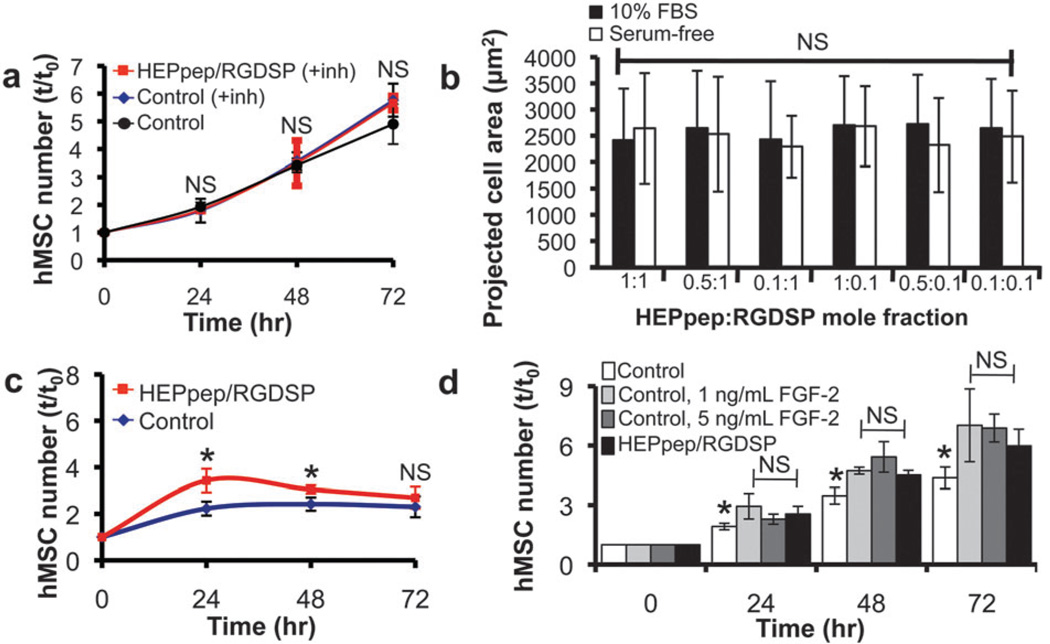
Fig. 4.
(A) hMSC number on SAMs presenting 2% RGDSP and either 2% HEPpep (red) or 2% scramble (blue) in medium supplemented with 10% FBS and 200 nM PD173074, an FGF receptor inhibitor, added to the medium at t = 0, or 2% RGDSP and 2% scramble in medium supplemented with 10% FBS (black). (B) Projected cell area of hMSCs on SAMs presenting RGDSP and HEPpep at co-varying surface densities in serum-free medium (white) or medium supplemented with 10% FBS (black). (C) hMSC number on SAMs presenting 2% RGDSP and either 2% HEPpep (red) or 2% scramble (blue) after overnight attachment in medium containing 10% FBS, followed by culture in serum-free medium supplemented with 10 ng/mL FGF-2 for 72 h. (D) hMSC number on SAMs presenting 2% RGDSP and 2% HEPpep in medium supplemented with 10% FBS (black) or on SAMs presenting 2% RGDSP and 2% scramble in medium supplemented with 10% FBS and 0 (white), 1 (light gray) or 5 (dark gray) ng/mL FGF-2. For (A) and (C) NS represents no significant difference compared to ‘control’ and * represents significant difference compared to ‘control’ (P < 0.05). For (D) NS represents no significant difference compared to ‘HEPpep/RGDSP’ and * represents significant difference compared to ‘HEPpep/RGDSP’ (P < 0.05).

