Figure 2.
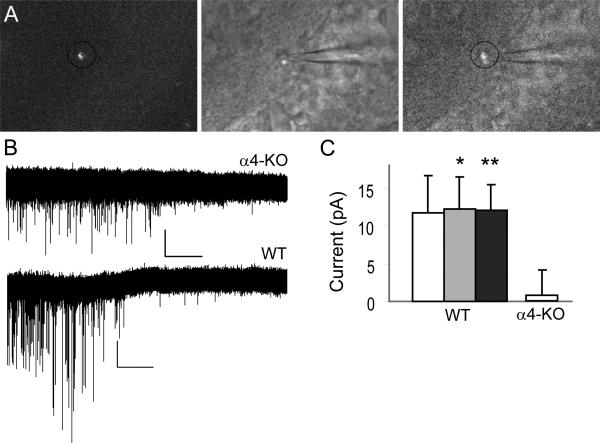
Whole-cell patch-clamp recordings from newborn granule cells. (A) Example of a fluorescently labeled cell (left), the corresponding differential interference contrast image (middle) and overlay of the two (right). (B) Representative traces recorded in mRFP+ cells from α4-KO (top) and WT (bottom) mice at 13 and 15 DPI, respectively, depicting the disappearance of phasic events upon application of the GABAAR antagonist bicuculline. A change in holding current, reflecting tonic inhibition, is visible in the trace from WT mouse only. (C) Average amplitude (± SEM) of tonic currents as revealed by application of bicuculline (10 μm; white, n = 4 for WT and n = 5 for α4-KO), picrotoxin (100 μm; gray, n = 12, WT), and the two datasets together (black, n = 16, WT). *P < 0.05, **P < 0.01; paired t-test.

