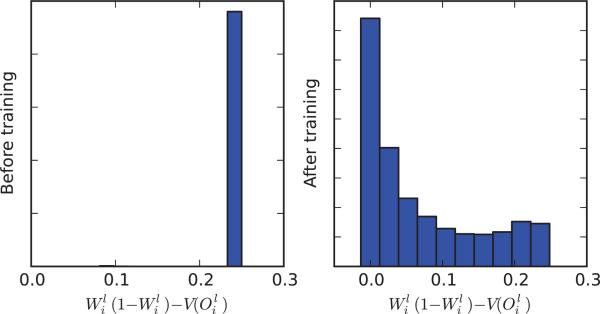
Figure 9.9.
Histogram of the difference between the dropout variance of and its approximate upperbound in a MNIST classifier network before and after training. Histograms are obtained by taking all non-input neurons and aggregating the results over 10 random input vectors. Note that at the beginnning of learning, with random small weights, , and thus whereas .

