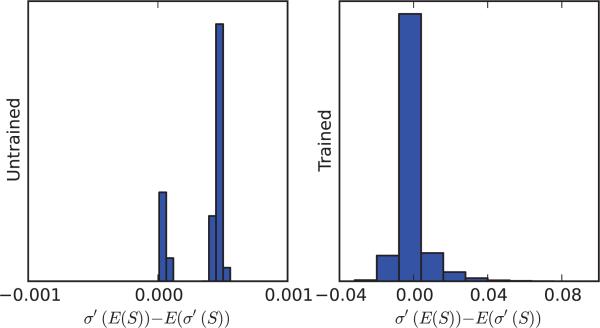
Figure 9.15.
Histogram of the difference between E(σ′(S)) and σ′(E(S)) all non-input neurons, in a MNIST classifier network, before and after training. Histograms are obtained by taking all non-input neurons and aggregating the results over 10 random input vectors. The nodes in the first hidden layer have 784 sparse inputs, while the nodes in the upper three hidden layers have 1200 non-sparse inputs. The distribution of the initial weights are also slightly different for the first hidden layer. The differences between the first hidden layer and all the other hidden layers are responsible for the initial bimodal distribution.

