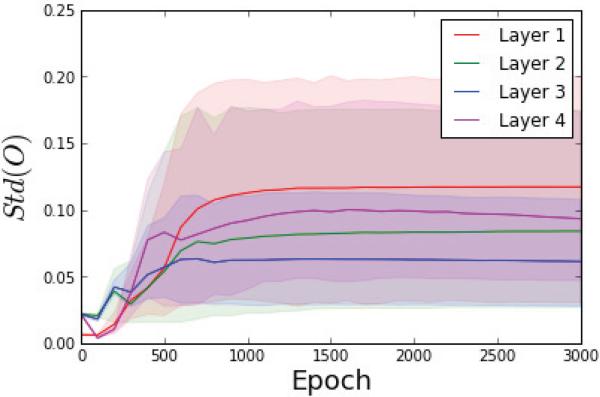
Figure 11.3.
Consistency of active neurons does not noticeably decline in the upper layers. ’Active’ neurons are defined as those with activation greater than 0.1 at the end of training. There were at least 100 active neurons in each layer. For these neurons, 1000 dropout simulations were performed at each time step of 100 training epochs. The plot represents the dropout mean standard deviation and 5%, 95% percentiles computed over all the active neurons in each layer. Note that the standard deviation does not increase for the higher layers.

