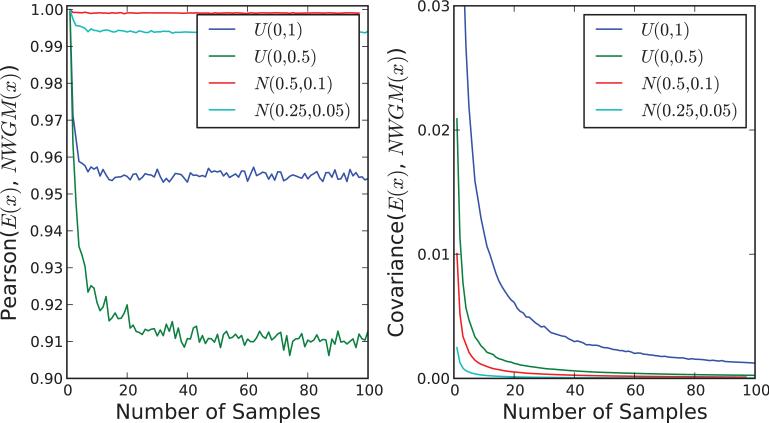
Figure 9.2.
Behavior of the Pearson correlation coefficient (left) and the covariance (right) between the empirical expectation E and the empirical NWGM as a function of the number of samples and sample distribution. For each number of samples, the sampling procedure is repeated 10,000 times to estimate the Pearson correlation and covariance. The distributions are the uniform distribution over [0,1], the uniform distribution over [0,0.5], the normal distribution with mean 0.5 and standard deviation 0.1, and the normal distribution with mean 0.25 and standard deviation 0.05.

