
Figure 2.
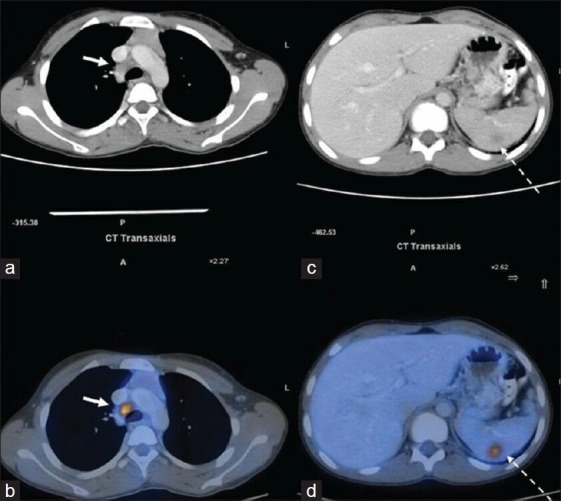
Transaxial contrast-enhanced computed tomography (a and c) and fused positron emission tomography/computed tomography (b and d) image shows fludeoxyglucose mediastinal lymphnodes (arrows). Additionally, a metabolically active focus was also noted in the spleen (dotted arrows)