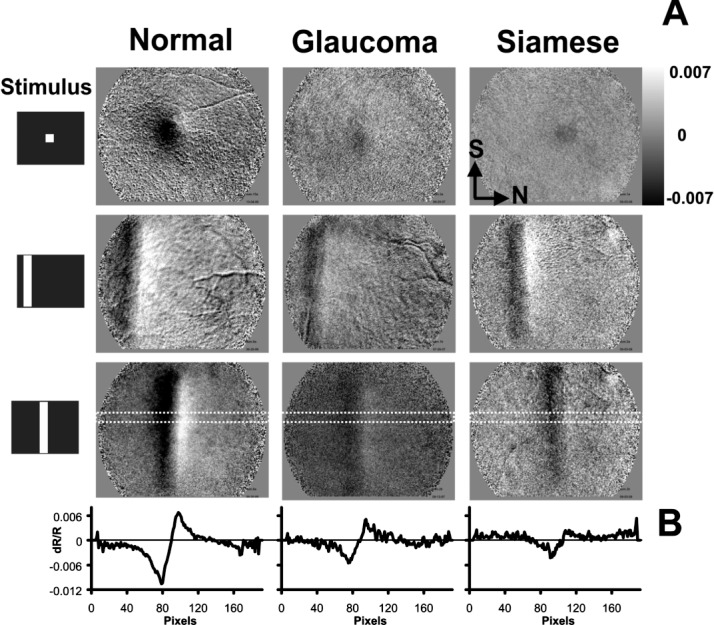
Figure 3.

Intrinsic optical signal spatial response. (A) Representative images from normal (left), glaucomatous (center), and Siamese control cats (right). Data show the retinal NIR response to three stimulus conditions, a spot stimulus (top), and two horizontally displaced vertical bars (middle and bottom). Data are from t = 5.0 to 6.0 seconds (just after stimulus presentation epoch, when signals are strongest). In all three cats, intrinsic signals are present that show a characteristic patterned response to the stimulus. All images are plotted on the same grayscale range (±0.007 dR/R). Normal cats show stronger activations in both the negative and positive signals, represented by more pixels reaching a saturated state within the grayscale limits. (B) A cross-sectional profile of intrinsic signal. An 11×192–pixel region (dotted trace in bottom of A) was averaged in the short dimension from the vertical bar condition in the lower panels of (A). Intensity data are now represented by the ordinate dimension (dR/R), and abscissas show distance in pixels in the nasal–temporal axis. Negative and positive signals are observed in each cat. Positive signals generally show a nasal bias to the negative signals. Slight shifts in signal position are due to positional variations of the stimulus within the field of view. Nasal (N) and superior (S) directions are shown in top right image for orientation.
