
Figure 5.
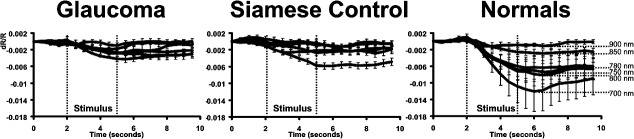
Average signal time course for wavelengths 700 to 900 nm. The averaged data from two glaucoma cats, a Siamese control, and seven normals are plotted. The wavelength dependence is represented for the normal data at right. The general shape of the intrinsic signal development remains the same for all cats tested despite reduced magnitude observed in Siamese and glaucoma cats. In this figure, signals show a similar onset, monophasic growth function and poststimulus decay period linked to the phase of the stimulus epoch (vertical lines). The specific wavelength dependence for glaucoma and Siamese controls is disambiguated in following figures. Error bars represent ±1 SEM of all averaged data from each cat group.