Figure 6.
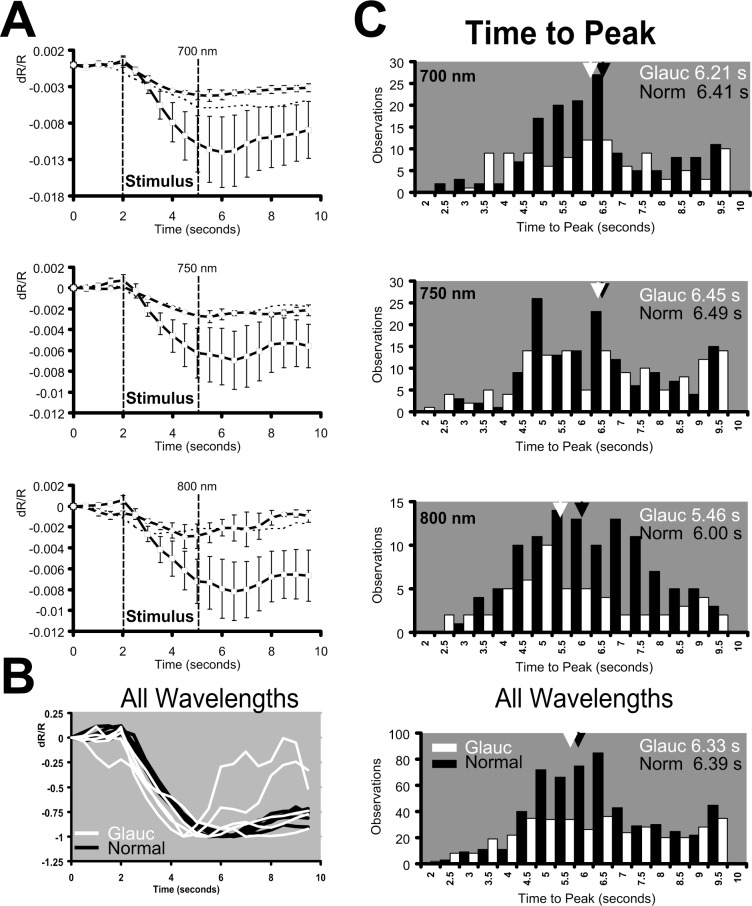
Time course analysis. (A) Average intrinsic signal time course for three representative wavelengths: 700, 750, and 800 nm. Data from normals (squares), glaucoma (diamonds), and the Siamese control (dotted line) are plotted. Each cat group showed similar slow onset first detectable from 0.5 to 1.0 second after stimulus onset. All signals grow monophasically for the duration of the stimulus epoch and peak 0.5 to 1.0 second after the stimulation is extinguished. The same general trend is observed across all cats, and all imaging wavelengths. Error bars represent ±1 SEM. (B) All data from wavelengths between 850 to 700 nm were pooled across the glaucoma (white) and normal cat groups (black). The response to each wavelength was then normalized and plotted on the same coordinates to show the similarities in signal time course without factoring intensity. In this averaging paradigm, a slight time-advance of the glaucoma data appears. (C) Time-to-peak analysis for glaucoma and normal cats. The time-to-peak for each acquired signal was performed to produce a single observation. Histograms show the distribution of individual time-to-peak analyses for 700 nm (top), 750 nm (middle), and 800 nm (bottom). Mean time-to-peak is represented by an arrowhead with adjacent text inset for normals (black) and glaucoma (white). A slight time advance of the signal peak was observed in the glaucoma cats, but did not reach statistical significance. Pooled observations across all wavelengths between 850 to 700 nm were analyzed in the bottom panel of (C) where the population shows 402 total observations for glaucoma cats and 592 total observations for normal cats.

