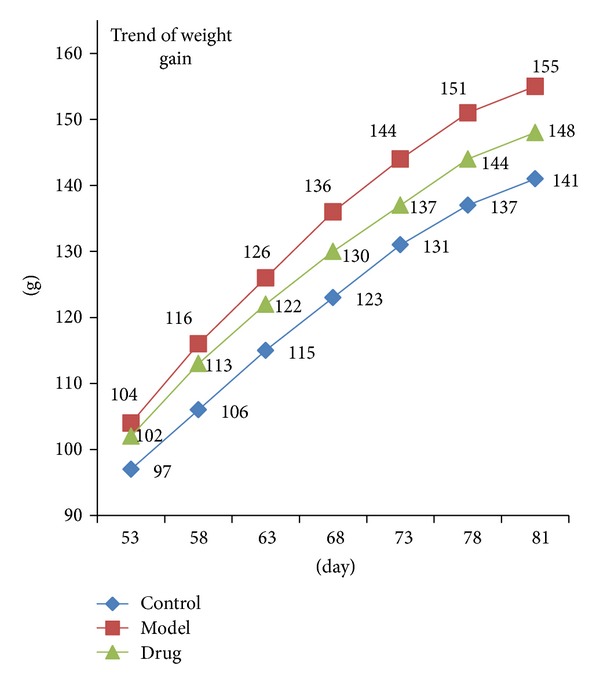
Figure 1.

Trends of the weight gain in three groups. The blue, red, and green lines represent the Control group, Model group, and Drug group, respectively. As is shown above, a gain in weight value of Drug group had been slowed down compared to the Model group rats.
