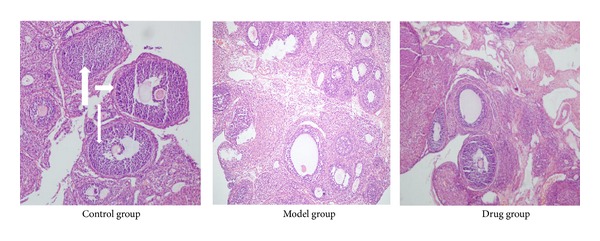
Figure 3.

Pathological morphology of ovarian tissues analyzed by light microscope. As is shown above, there were significant differences in color, the numbers of follicles (short thick arrows) and corpora lutea (long thick arrow), and the numbers of granulosa cell layer (long thin arrows) not only between the Model group and the Control group but also between the Drug group and the Model group.
