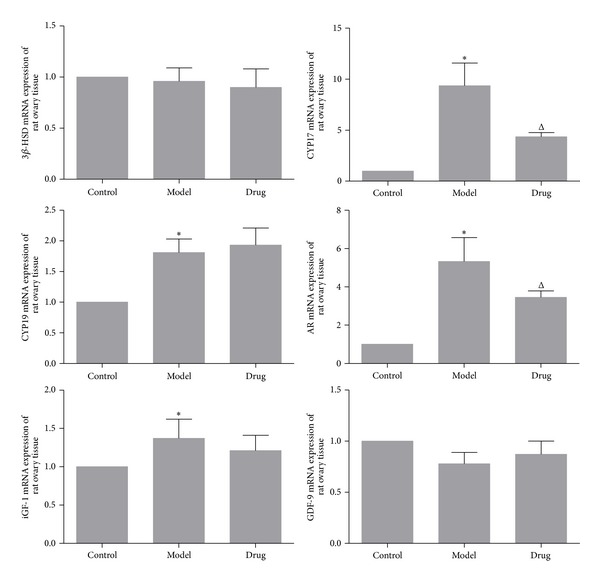
Figure 4.

The genes expression of ovarian tissues analyzed by Real-Time PCR. As is shown above, there were no obvious differences between 3β-hsd mRNA and gdf-9 mRNA among the three groups. The expression of cyp17 mRNA (9.35 ± 2.23), cyp19 mRNA (1.81 ± 0.22), ar mRNA (5.33 ± 1.24), and igf-1 mRNA (1.37 ± 0.25) in Model group was increased significantly than in the Control group (1.00 ± 0.00). After drug intervention, the expression of cyp17 mRNA (4.36 ± 0.39) and ar mRNA (3.45 ± 0.34) was statistically decreased, while cyp19 mRNA and igf-1 mRNA had no statistical differences (cyp19 mRNA: 1.93 ± 0.28; igf-1 mRNA: 1.21 ± 0.20). Model group (n = 6) versus Control group (n = 6): *P < 0.05; Drug group (n = 6) versus Model group (n = 6): Δ P < 0.05.
