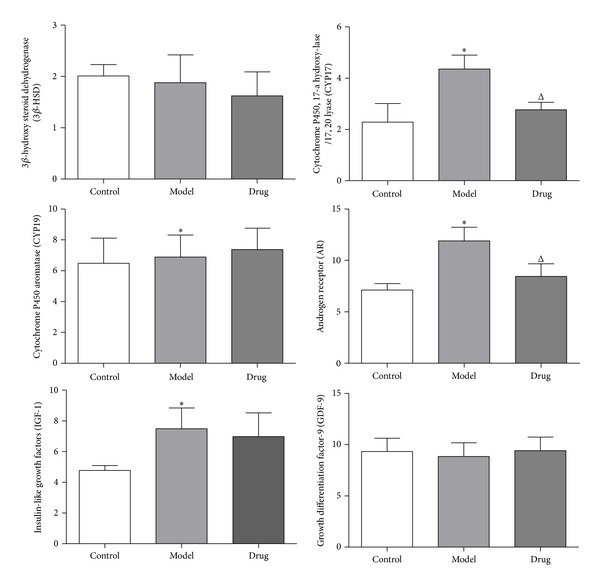
Figure 6.

The protein expression of ovarian tissues analyzed by IHC. As is shown in the histogram above, except 3β-HSD and GDF-9, the expression of CYP17, CYP19, AR, and IGF-1 significantly increased in Model group than that of Control group, while in Drug group only CYP17 and AR were decreased according to statistics. Model group (n = 6) versus Control group (n = 6): *P < 0.05; Drug group versus Model group (n = 6): Δ P < 0.05.
