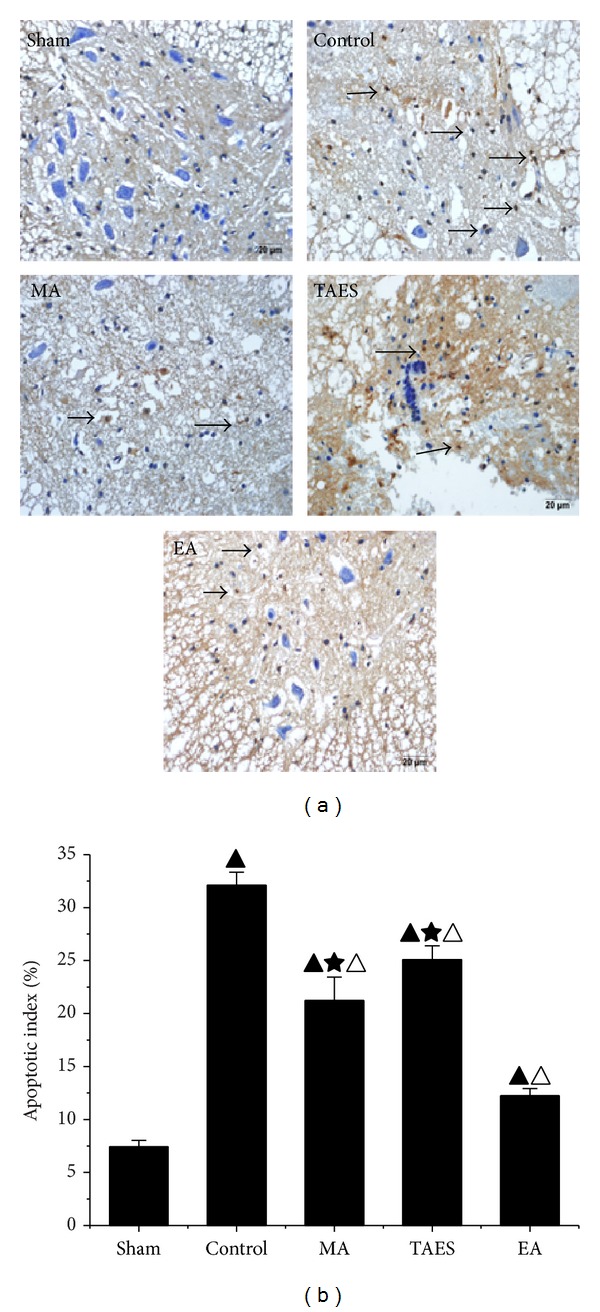
Figure 4.

(a) TUNEL staining identified apoptotic neurons. (b) Apoptotic index. In the sham group, there were almost no TUNEL-positive cells. In the control group, positive cells were significantly increased and widely distributed in both the white and gray matters. In the control group, neurons shrank and exhibited abnormal morphology with condensed chromatin, introverted nuclear membranes, and increased apoptotic bodies (dash-line arrow). Neurons in the EA, MA, and TAES groups, however, showed less condensed chromatin and clear nuclear membranes. EA group, however, showed significantly decreased brown-positive cells compared with that of the control group (data are presented as mean ± SD, ▲ P < 0.05, versus sham group; △ P < 0.05, versus control group; ★ P < 0.05, versus EA group). N = 8 animals per group.
