Figure 1.

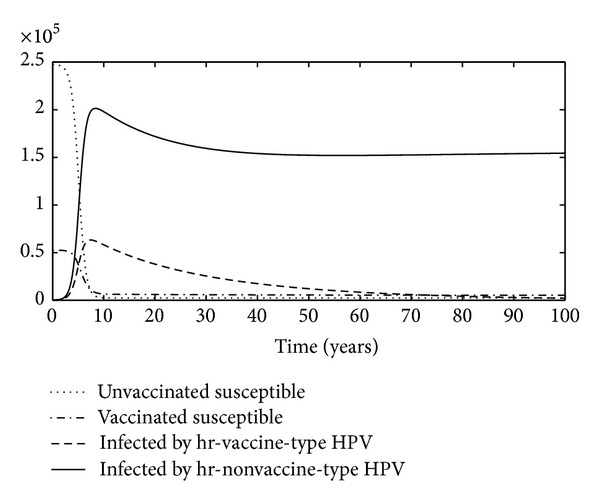
The graphs show unvaccinated susceptible, vaccinated susceptible, infected with vaccine-type HPV, and infected with nonvaccine-type HPV versus years.

The graphs show unvaccinated susceptible, vaccinated susceptible, infected with vaccine-type HPV, and infected with nonvaccine-type HPV versus years.