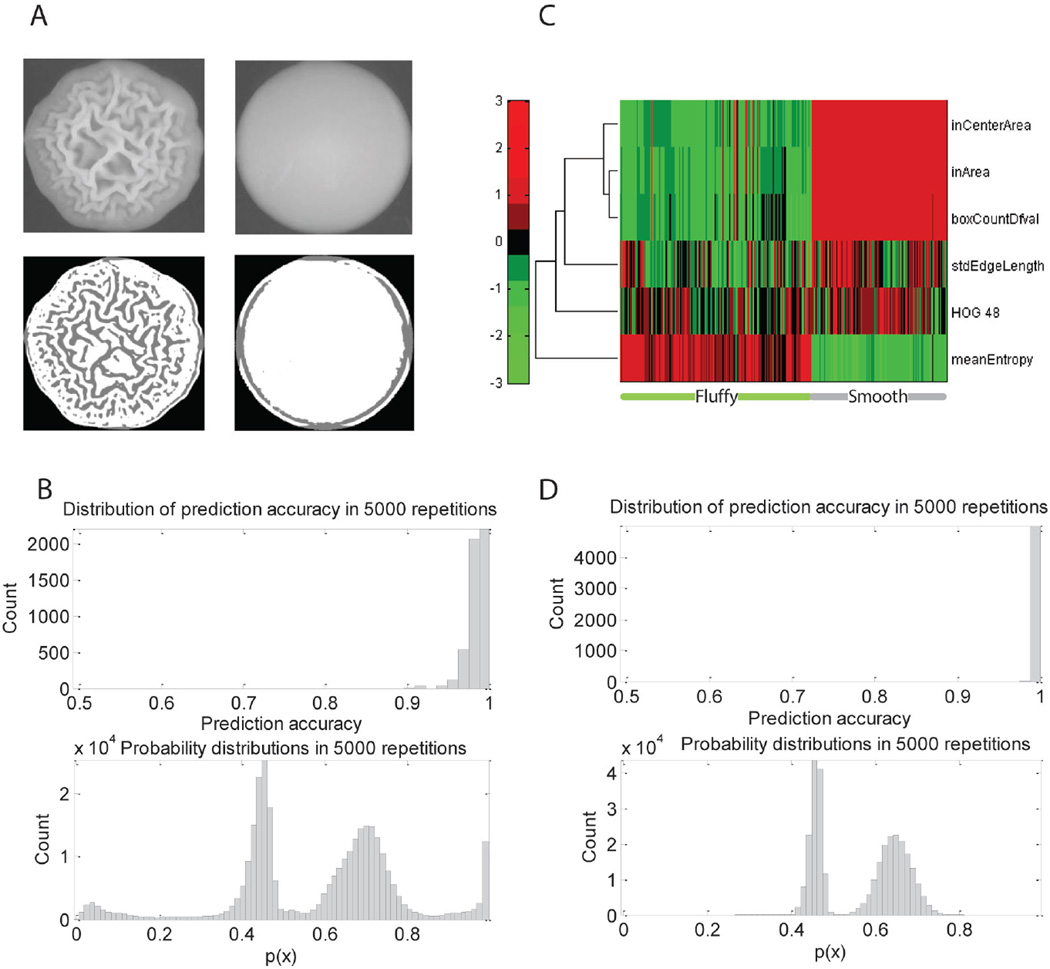
Figure 2. Phenotype analysis of colonies from static images.
(A) Example images of fluffy and smooth phenotypes and the corresponding segmentation results. (B) Classification accuracies (top) and probability values (bottom) for class representing the complex phenotypes during the 5000 repetitions. (C) Hierarchical clustering of the selected feature subspace shows how the features chosen by the logistic regression classifier separate the phenotypes and how the colonies within a phenotype show similar feature patterns. (D) Classification accuracies (top) and probability values (bottom) for class representing the complex phenotypes during 5000 repetitions of hold-out error estimation after excluding respiratory deficient mutants.

