
Figure 3.
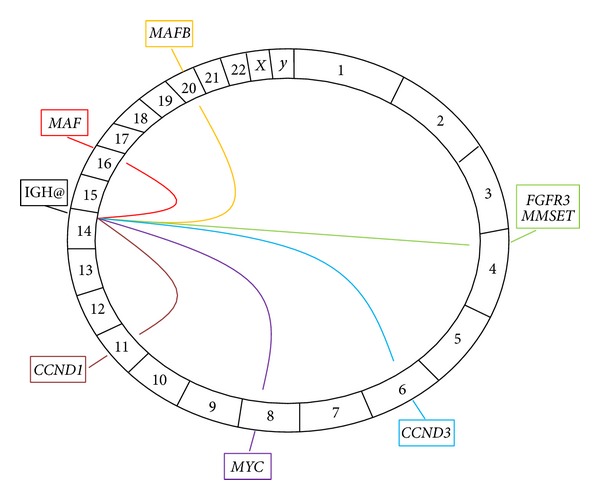
The key chromosomal translocations in myeloma. A Circos plot, with the chromosomes arranged in a clockwise direction, demonstrating the key translocations in myeloma. The translocations are represented as lines emerging from the immunoglobulin heavy chain (IGH@) locus on chromosome 14 to their respective partner chromosomes. The genes involved in each translocation are represented in boxes outside the plot. All translocations represent primary events except t(8; 14) involving MYC which is a secondary translocation.