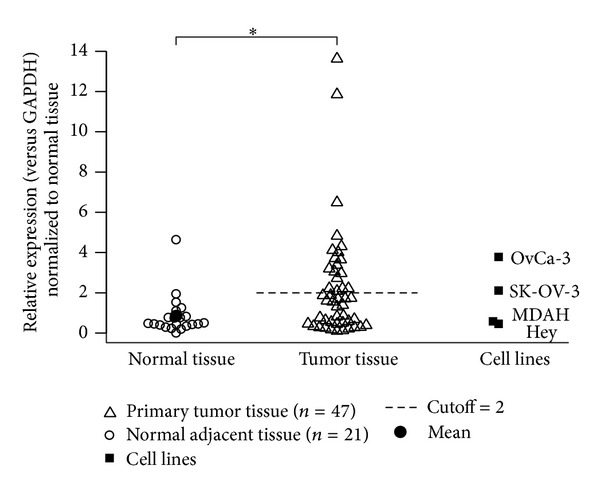
Figure 1.

CapG expression in normal and OC tumor tissues. CapG expression in primary tumor tissue samples from 47 patients with OC was analyzed by qRT-PCR and compared to normal adjacent tissue samples (n = 21). Single probes were normalized to housekeeping gene GAPDH. Mean expression in normal tissue was calculated and standard deviation added for upper cutoff (dashed line). Thus, expression levels greater than 2.0-fold above mean CapG expression in controls was defined as overexpression and 38% of all tumor samples display such results. To the right, CapG expression of ovarian carcinoma cell lines OvCa-3, SK-OV-3, MDAH, and Hey. Each sample was analyzed in duplicates and repeated three times.
