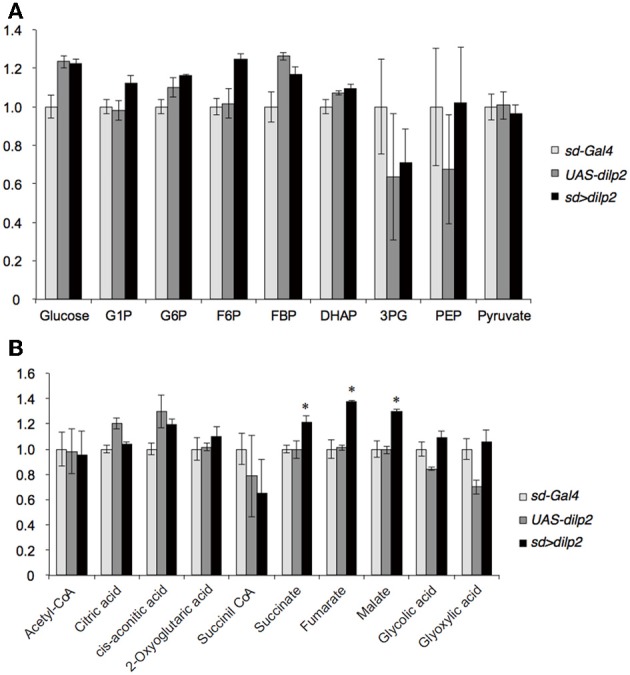
Figure 5.

Glucose metabolism in dilp2-overexpressing flies. Glycolysis (A) and TCA cycle (B) metabolites were analyzed by using LC-MS/MS in negative mode. Relative amounts of metabolites in the sd > dilp2 flies were calculated based on the values of the parental lines (sd- Gal4) and shown as the mean ±S.E of at least three samples with a minimum of five flies per group. G6P: glucose 6-phosphate;F6P: fructose 6-phosphate; F1,6BP: fructose 1,6-bisphosphate; 2/3-PG: 2/3-phophoglycerate; PEP: phosphoenolpyruvate. Student t-test was performed to analyze statistical significance. *p < 0.05
