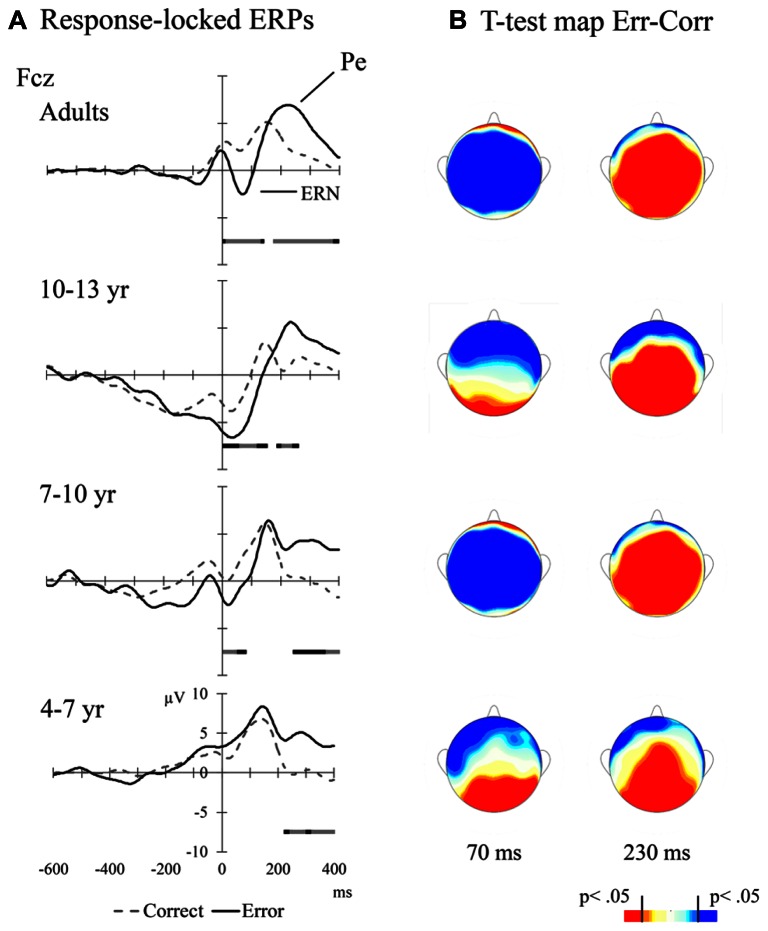
FIGURE 4.
(A) Response-locked ERPs for adults and children at mid-frontal leads. The bars above the temporal scale show when the Error-Correct response t-test is significant (light gray: p < 0.01, black: p < 0.05, dark gray: p < 0.1); (B) Scalp distributions of the error vs. correct responses t-test values at particular times after the response (70 ms for ERN and 230 ms for Pe in all age groups)

