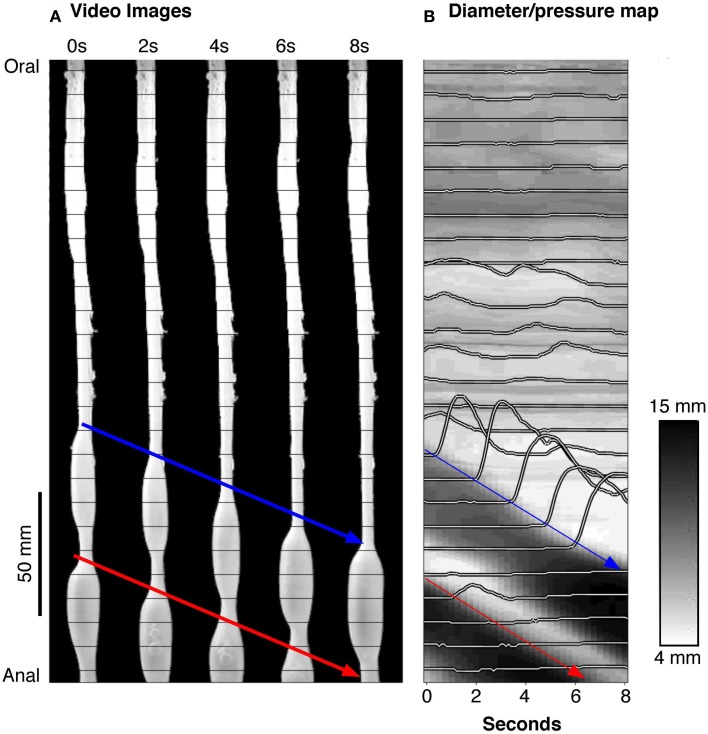
Figure 1.
(A) A series of silhouettes of the rabbit colon taken at 2 s intervals during the movement of a bolus. The thin horizontal lines indicate the location of the fiber-optic pressure sensors (at 10 mm intervals). (B) A spatiotemporal diameter map (DMap) created from the same 8 s period with the multichannel intraluminal pressure traces (recorded by the fiber-optic catheter) superimposed. The blue and red arrows represent individual bolus movement in both (A,B). On the DMap (B), the movement of the bolus is represented by the oblique dark bands (representing distension). At the blue arrow in (B), it is clear that the onset of contraction is associated with large pressure waves (recorded by the catheter sensors).

