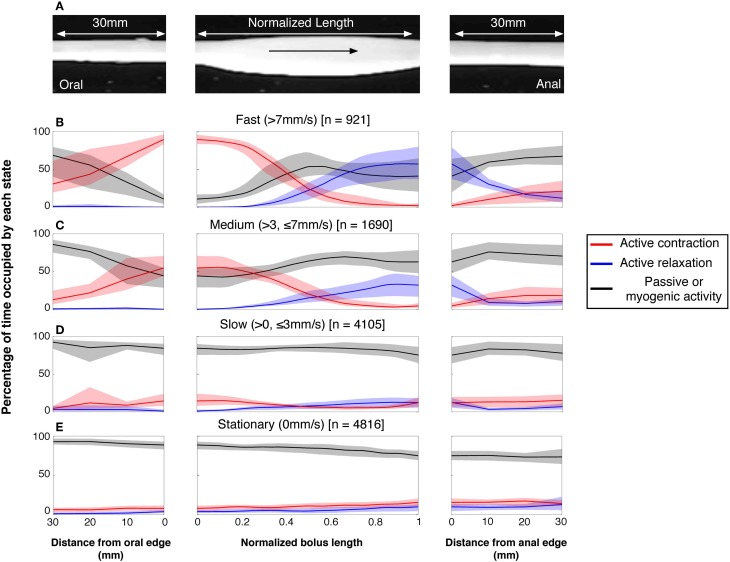
Figure 11.
The neurogenic active states associated with all moving and stationary boluses in the rabbit distal colon. (A) The active states were calculated on a frame by frame basis in a 30 mm section of gut before and after the bolus and throughout the actual location of the bolus. In (B–E), the red lines indicate the percentage time occupied by active contractions at each frame of analysis. The blue lines indicate the active relaxation and the black lines represent all other muscular states (passive and myogenic). The color-coded shading around each line represents the 95% confidence interval for the mean percentages over each rabbit. The speed of propagation has been divided into 3 bins (B) > 7 mm/s; (C) > 3 ≤ 7 mm/s; (D) > 0 ≤ 3 mm/s with stationary boluses shown in (E). The number in the square brackets indicate the number of analyzed frames in each velocity bin. As can be seen at the fastest velocity there is a strong association between active contractions at the oral end and active relaxation at the anal end. As the speed of movement slows, this association drops and at the slowest speeds the active contractions and relaxations are almost gone. This loss of association is due, at least in part, to current analytical model. As the bolus movement slows our model begins to define the bolus as being stationary (see Figure 4). The stationary boluses have no association with active contractions or relaxations.

