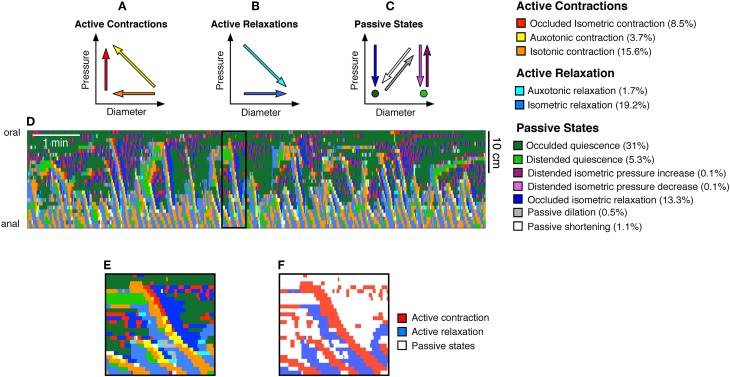
Figure 3.
From the orbital plots, 12 mechanical states were identified as described before (Costa et al., 2013b). These mechanical states were divided into (A) active contractions, (B) active relaxations, and (C) passive states. The color coded arrows shown in (A–C) indicate the trajectories of pressure and diameter which define each state. For example, the red arrow in (A) indicates an increase in pressure with no change in diameter, and this mechanical state represents an occluded isometric contraction. Taking the same DPMap shown in Figure 2A we can then determine the location and timing of each of these states and superimpose them upon the map (D). The numbers in brackets at the end of the mechanical state descriptors indicate the percentage time occupied by each state in this spatiotemporal map. This map (D) is complex to interpret but can be readily simplified by identifying just two types of states: active contraction (3 states shown in A) and active relaxation (2 states in B). This has been carried out for the black outlined area in (D), shown on a longer timebase in (E,F) in which active contraction is red, active relaxation is blue and other passive states are white.

