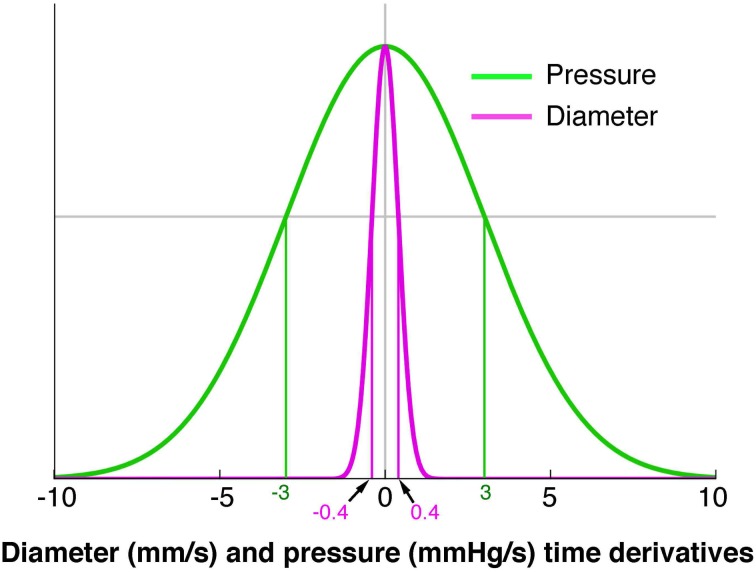
Figure 4.
A model of the probability of a mechanical state being regarded as quiescent. The green line represents pressure and the magenta represents diameter. The x axis indicates the diameter (mm/s) or pressure (mmHg/s) time derivatives. The y axis represents conditional probability of quiescence at a given diameter or pressure time derivative. A value of 0 for either pressure or diameter indicates a strong probability of a quiescent state. A Hidden Markov Model was used to determine when a state moved from quiescence to activity (Wiklendt et al., 2013). Normalizing the pressure and diameter data was achieved by dividing each value by a constant defining the width of the quiescence model conditional probability curve (shown at vertical green and magenta lines). The constant for pressure was 3 mmHg/s and the constant for diameter was 0.4 mm/s.

