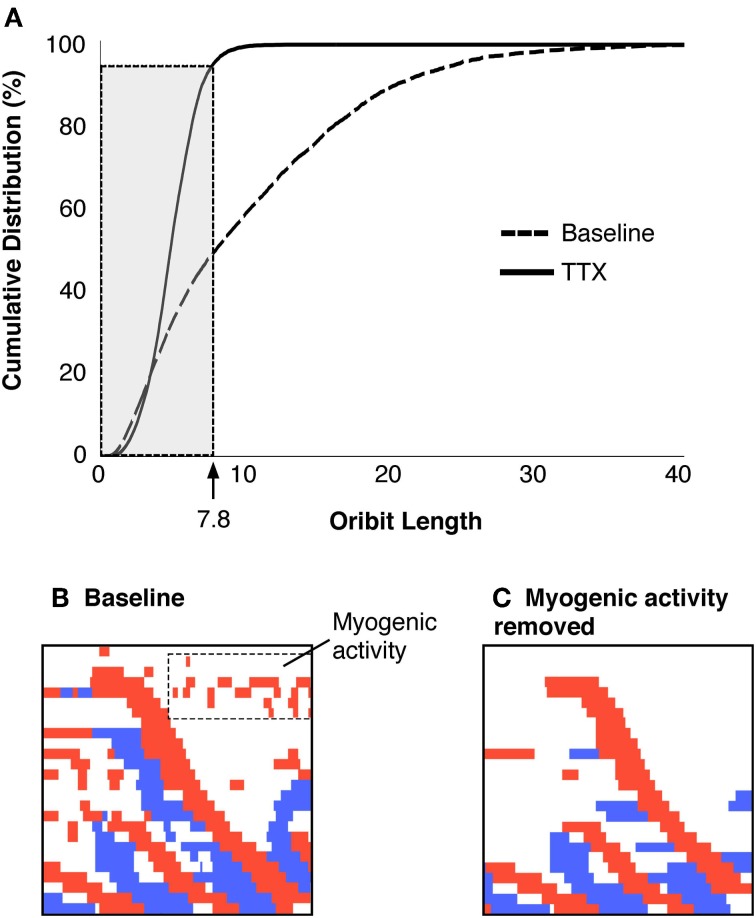
Figure 6.
(A) Criteria to identify and remove myogenic activity. The cumulative distribution of orbital lengths calculated from preparations exposed to TTX are plotted (solid black line), with the cumulative distribution without TTX (dashed line, A). The cutoff that removed 95% of the myogenic activity was identified (value = 7.8). All points on the active-state map with orbit plots of 7.8 or less were removed from the data and remaining activity was considered to be neurogenic. The region shown in Figure 3F is shown with all activity displayed (B) and after myogenic activity is removed (C).

