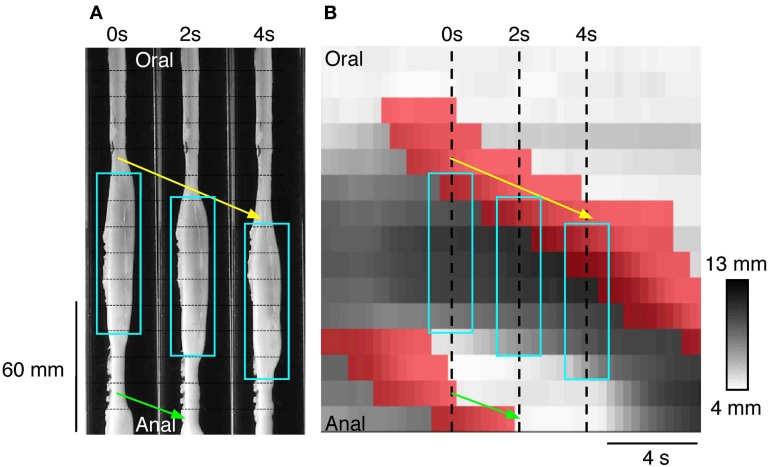
Figure 8.
(A) Three silhouettes of the rabbit distal colon captured at 2 s intervals. The horizontal thin hatched lines on the silhouettes are spaced at 1 cm intervals and the fiber-optic pressure sensors are located between each of these lines. A propagating contraction can be seen on the silhouettes (connected by the yellow arrow) and this moves in an anal direction from the first to the third silhouette. Aqua rectangles surround the regions of distension. Part of a second propagating contraction (connected by the green arrow) can be seen at the bottom of panels 0 and 2 s. (B) The corresponding spatiotemporal DMap with the regions of active contraction shown in red. The three hatched vertical line represent the location of the three silhouettes shown in (A). The areas in red a preceded by darkened regions (distended) on the DMap corresponding to the dilated areas within the white boxes in (A). While it may appear as though there is a propagating contraction at both the oral and anal end of the aqua boxes in (A) it is important to note that at the anal end of the box no contraction has occurred. The red region at the bottom of the panel in (B) is actually associated with the second propagating contraction (green arrow in A). At the anal end of each aqua box superimposed upon (B) there is no red region. This indicates that the gut is maintaining resting tone in its unstimulated state. Thus, by combining changes in diameter with changes in pressure we are able to determine when the gut is contracting and when the gut is at rest. This information cannot be determined from the DMap alone.

