
Figure 5.
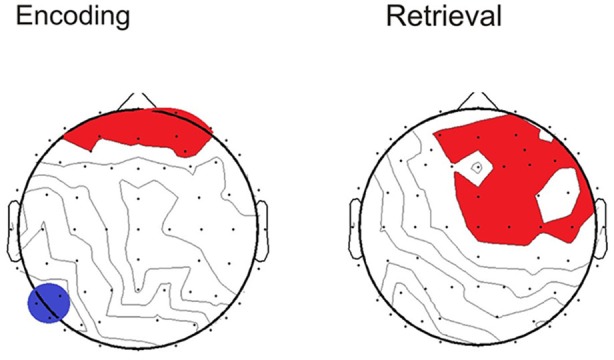
Topographical maps display the Pearson’s r correlation between task performance and SSVEP amplitude for the older group. Time points correspond to the topographical maps shown in Figure 4. Red highlighting indicates a positive relationship and blue indicates negative (p < 0.05).