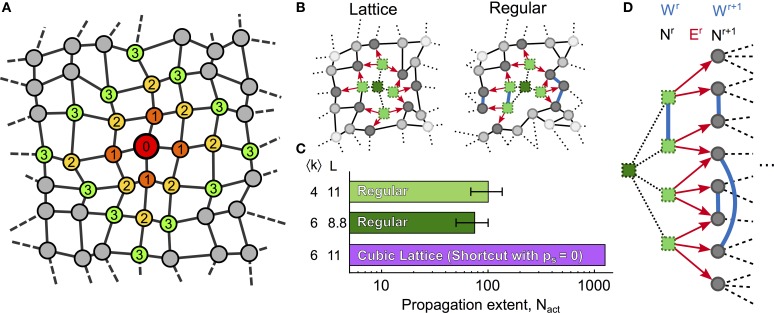
Figure 4.
Shell analysis. (A) Ilustration of shells 1–3 in a generic network; nodes are colored according to their topological distance (numbers) from a red reference node. A shell is a set of nodes that have the same topological distance r to the reference node (thus the same color in the figure). (B) 2D representation of ICW propagation (red arrows) in a cubic lattice and a regular network with identical mean degree. Bright green squares represent activated cells while dark green squares denote cells that were previously activated by the ICW. (C) Despite sharing similar topological features, propagation in the cubic lattice may activate up to 10-fold more cells than in regular networks. (D) Shell analysis reveals that this difference in ICW propagation may be attributable to the connections between cells within the same r-th shell (Wr) in regular networks, which reduce the quantity of IP3 given to astrocytes in the next shell r + 1, thus resulting in earlier propagation failures than in cubic lattices. Definitions of Nr, Wr, and Er are given in the main text. Cubic lattices were built by shortcut networks with ps = 0 and mlatt = 1 (see “Methods”). Model parameters as in Table 1.

