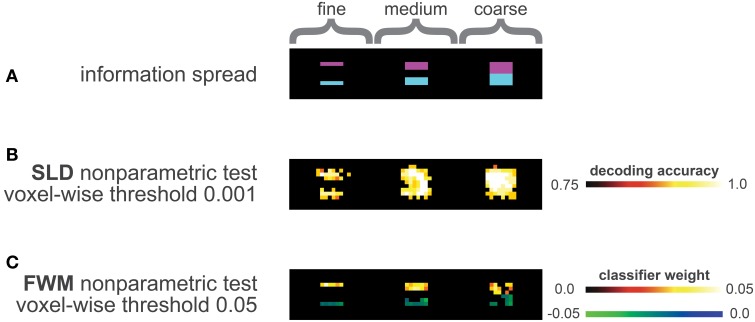
Figure 3.
Analysis of the data simulation (A) Distribution of information, the three violet half-cubes contained class information for condition A, the three blue half-cubes contained class information for class B. In total, three distinct levels of geometry of information distribution were simulated, the leftmost half-cubes represented a fine information spread, the middle ones an intermediate level and the rightmost half-cubes a coarse information spread. (B) Results of SLD method corrected with the non-parametric framework (including multiple comparison correction), using a voxel-wise threshold of p vox = 0.001 (one-sided). (C) Results of FWM method corrected with the non-parametric framework (including multiple comparison correction) using a voxel-wise threshold of p vox = 0.05 (two-sided). The blue-green colors represent influence toward class B, the red colors for influence toward class A.

