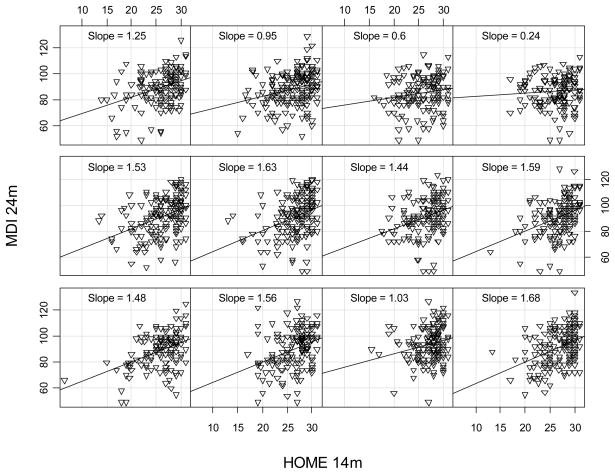
Figure 4.
Conditional scatter plots for the Home Observation for the Measurement of the Environment measured at 14m predicting the Mental Development Index measured at 24m for 12 groups defined by average lag. Average lags increase from left to right and from bottom to top. Average lag (months) for each plot: 5.52, 8.28, 8.85, 9.25, 9.61, 9.89, 10.16, 10.46, 10.80, 11.28, 11.98, and 14.57.

