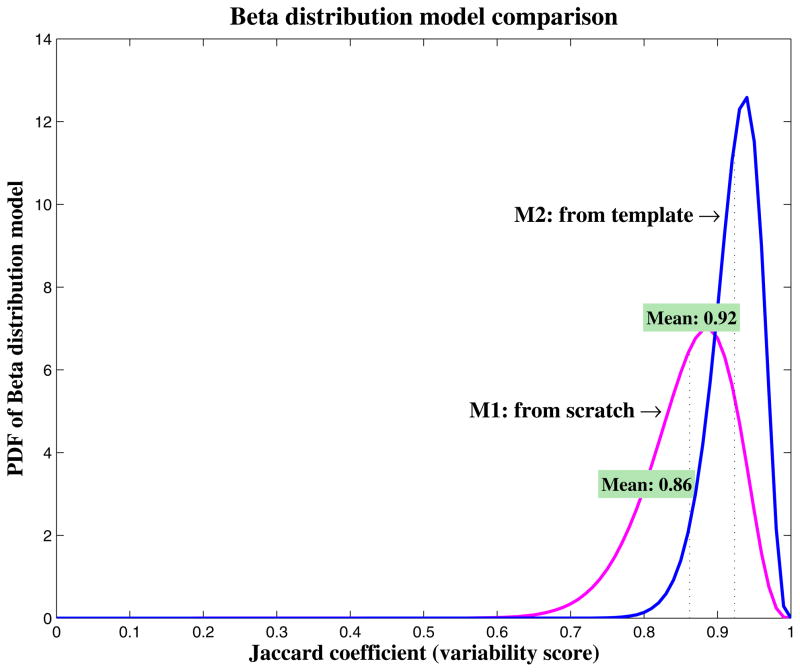
Figure 3.
Comparison of beta distribution models (as probability density function [PDF]) for contouring from scratch and contouring from the template. The higher, narrower, and sharper the curve, the smaller the inter-observer variability. Contouring from the template showed a smaller inter-observer variability than contouring from scratch.

