
Figure 1.
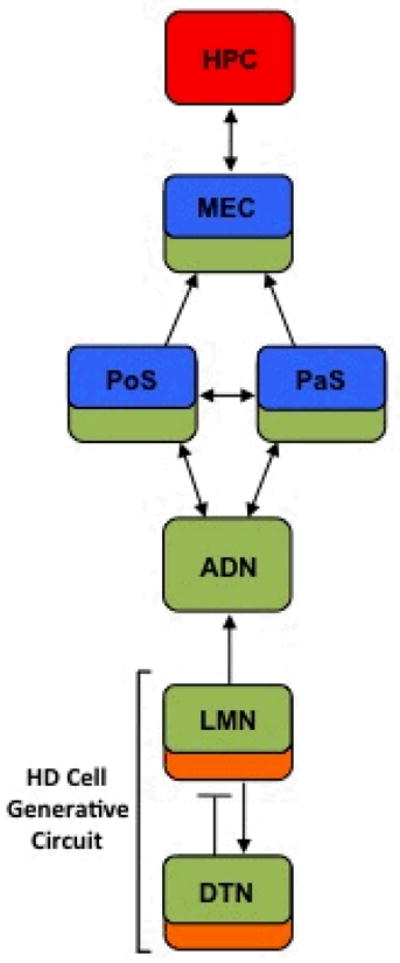
Diagram showing the principal connections between brain regions containing place cells (yellow), grid cells (red), HD cells (green), and angular velocity cells (orange) (see Taube (2007)). Arrows represent the direction of information flow. Solid lines indicate excitatory projections, and lines with bar represent inhibitory projections. ADN, anterodorsal thalamus; DTN, dorsal tegmental nucleus; HPC, hippocampus; LMN, lateral mammillary nuclei; MEC, medial entorhinal cortex; PaS, parasubiculum; PoS, postsubiculum.