
Figure 3.
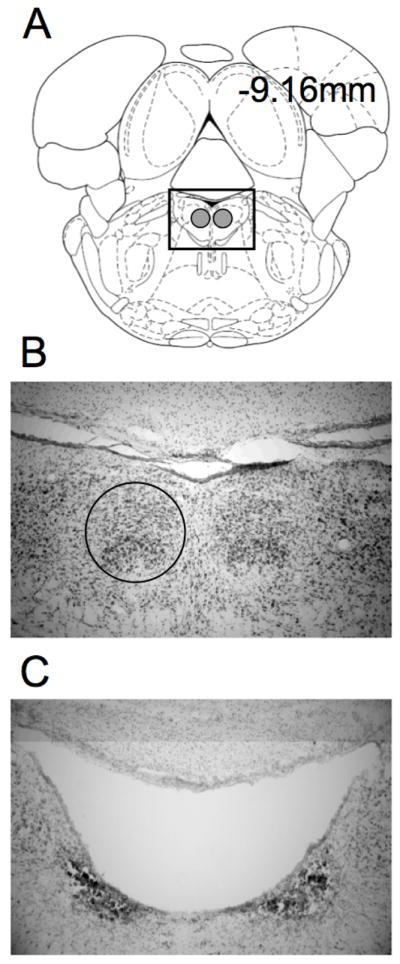
A) Select plate from Paxinos and Watson (1998) showing a section through the DTN at −9.16 mm posterior to bregma. The gray circles show the location of the DTN. B) An enlarged view of the boxed area in A in a representative section from a control rat. The circle outlines the location of the right DTN. C) Representative section from a rat with electrolytic damage of the DTN. Note the complete loss of tissue in the vicinity of the DTN.