
Figure 2.
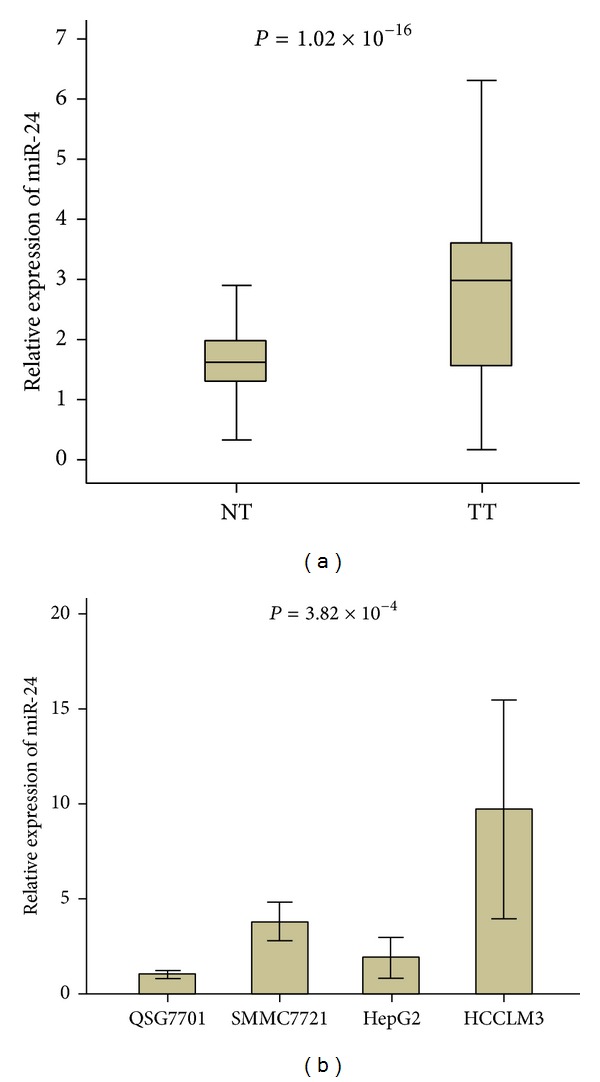
MiR-24 expression related with HCC tumorigenesis. (a) miR-24 expression was evaluated in the tumor tissues versus in the adjacent noncancerous tissues. The relative expression of miR-24 is shown as box plots, with horizontal lines representing the median, the bottom, and the top of the boxes representing the 25th and 75th percentiles, respectively, and vertical bars representing the range of data. We compared the difference among group using the Mann-Whitney U test. (b) miR-24 expression was higher in cancer cell line SMMC-7721 than in noncancer cell line QSG-7701.